The spectral signature of interstellar scintillation
Twinkle twinkle little black hole
 Orion Nebula. Image credit: Hubble, NASA, and STScI)
When the light from stars passes through the Earth’s atmosphere, the light waves are distorted and result in the “twinkling” affect we see at night. Analogously, when the radio light from a quasar passes through a cloud of dust in the interstellar medium, these radio waves are distorted and produce a highly variable signal over days to months that we can observe on Earth. By studying this variability, we can learn more about the material in the interstellar medium.
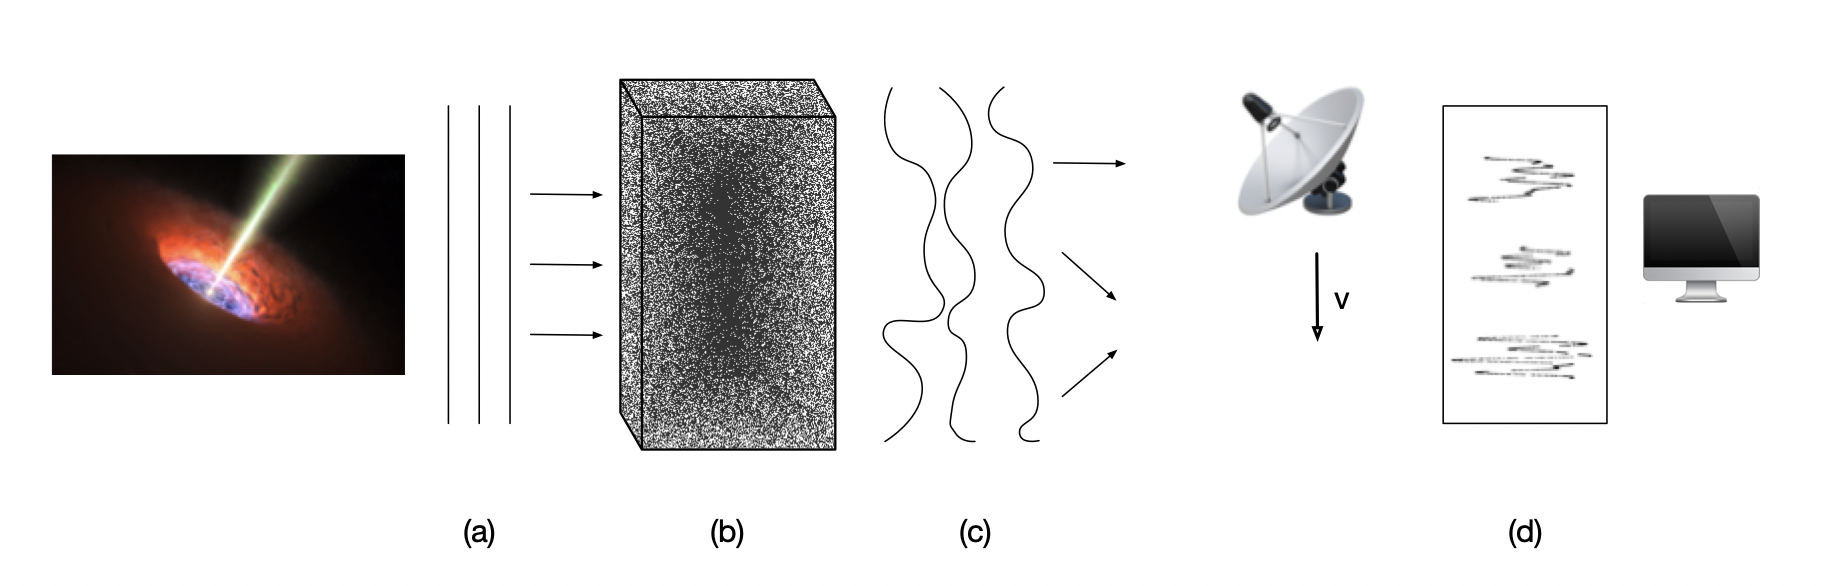
During the Summer of 2016—2017, I undertook a project at the CSIRO Astronomy and Space Science (CASS) office in Perth, Australia with Dr Cormac Reynolds to study this kind of quasar variability. The properties of scintillation vary depending on the properties of the medium and the frequency you observe at, and can be primarily characterised by a number called the modulation index, alongside the structure function:
$$ M = \frac{\sqrt{\langle F^2 \rangle}}{\langle F \rangle}$$
$$ SF = \sqrt{|F(T_i) - F(T_j)|^2}$$
where F is the flux at the given wavelength and T is the timescale of variability. Together these give both the typical strength and timescale of the variation.
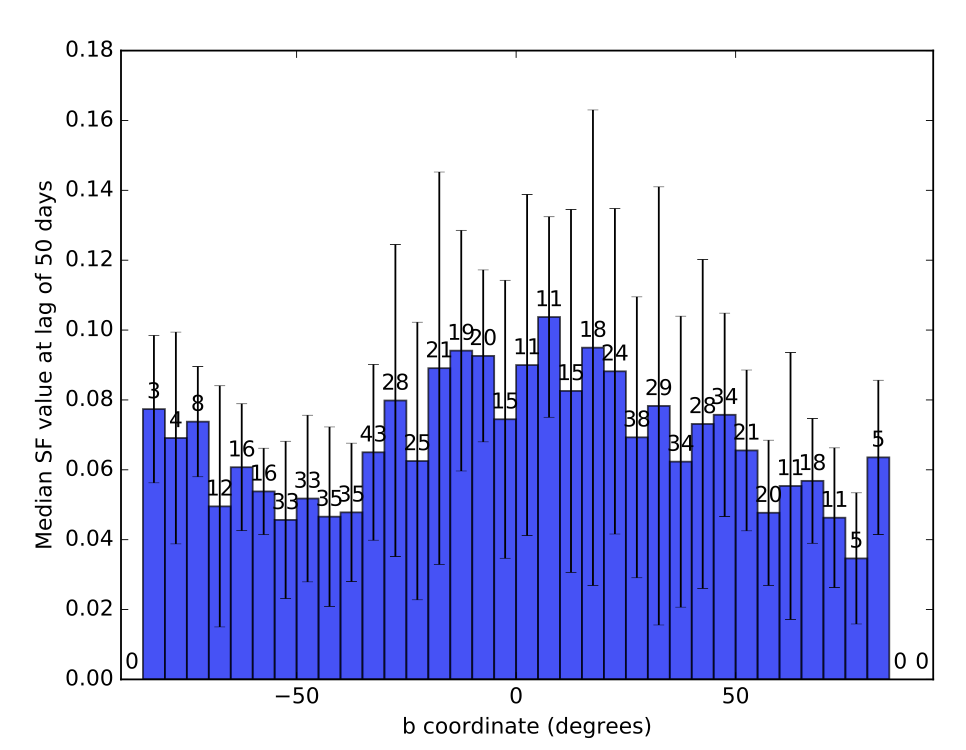
We used a sample of 2232 quasars from the Australian Telescope Extreme Scattering Events Survey (ATESE) pipeline observed from 2014—2016, across a frequency range of 2—12 GHz and covering a wide range on the sky. Limiting ourselves to those sources which had >1% variation on a timescale of 50 days, we found a slight bias towards greater variation in the galactic plane (b=0).